Growth and Usage dashboards
The Mozilla Growth & Usage dashboards (GUD) are visualizations of growth metrics in a standard way across Mozilla’s products.
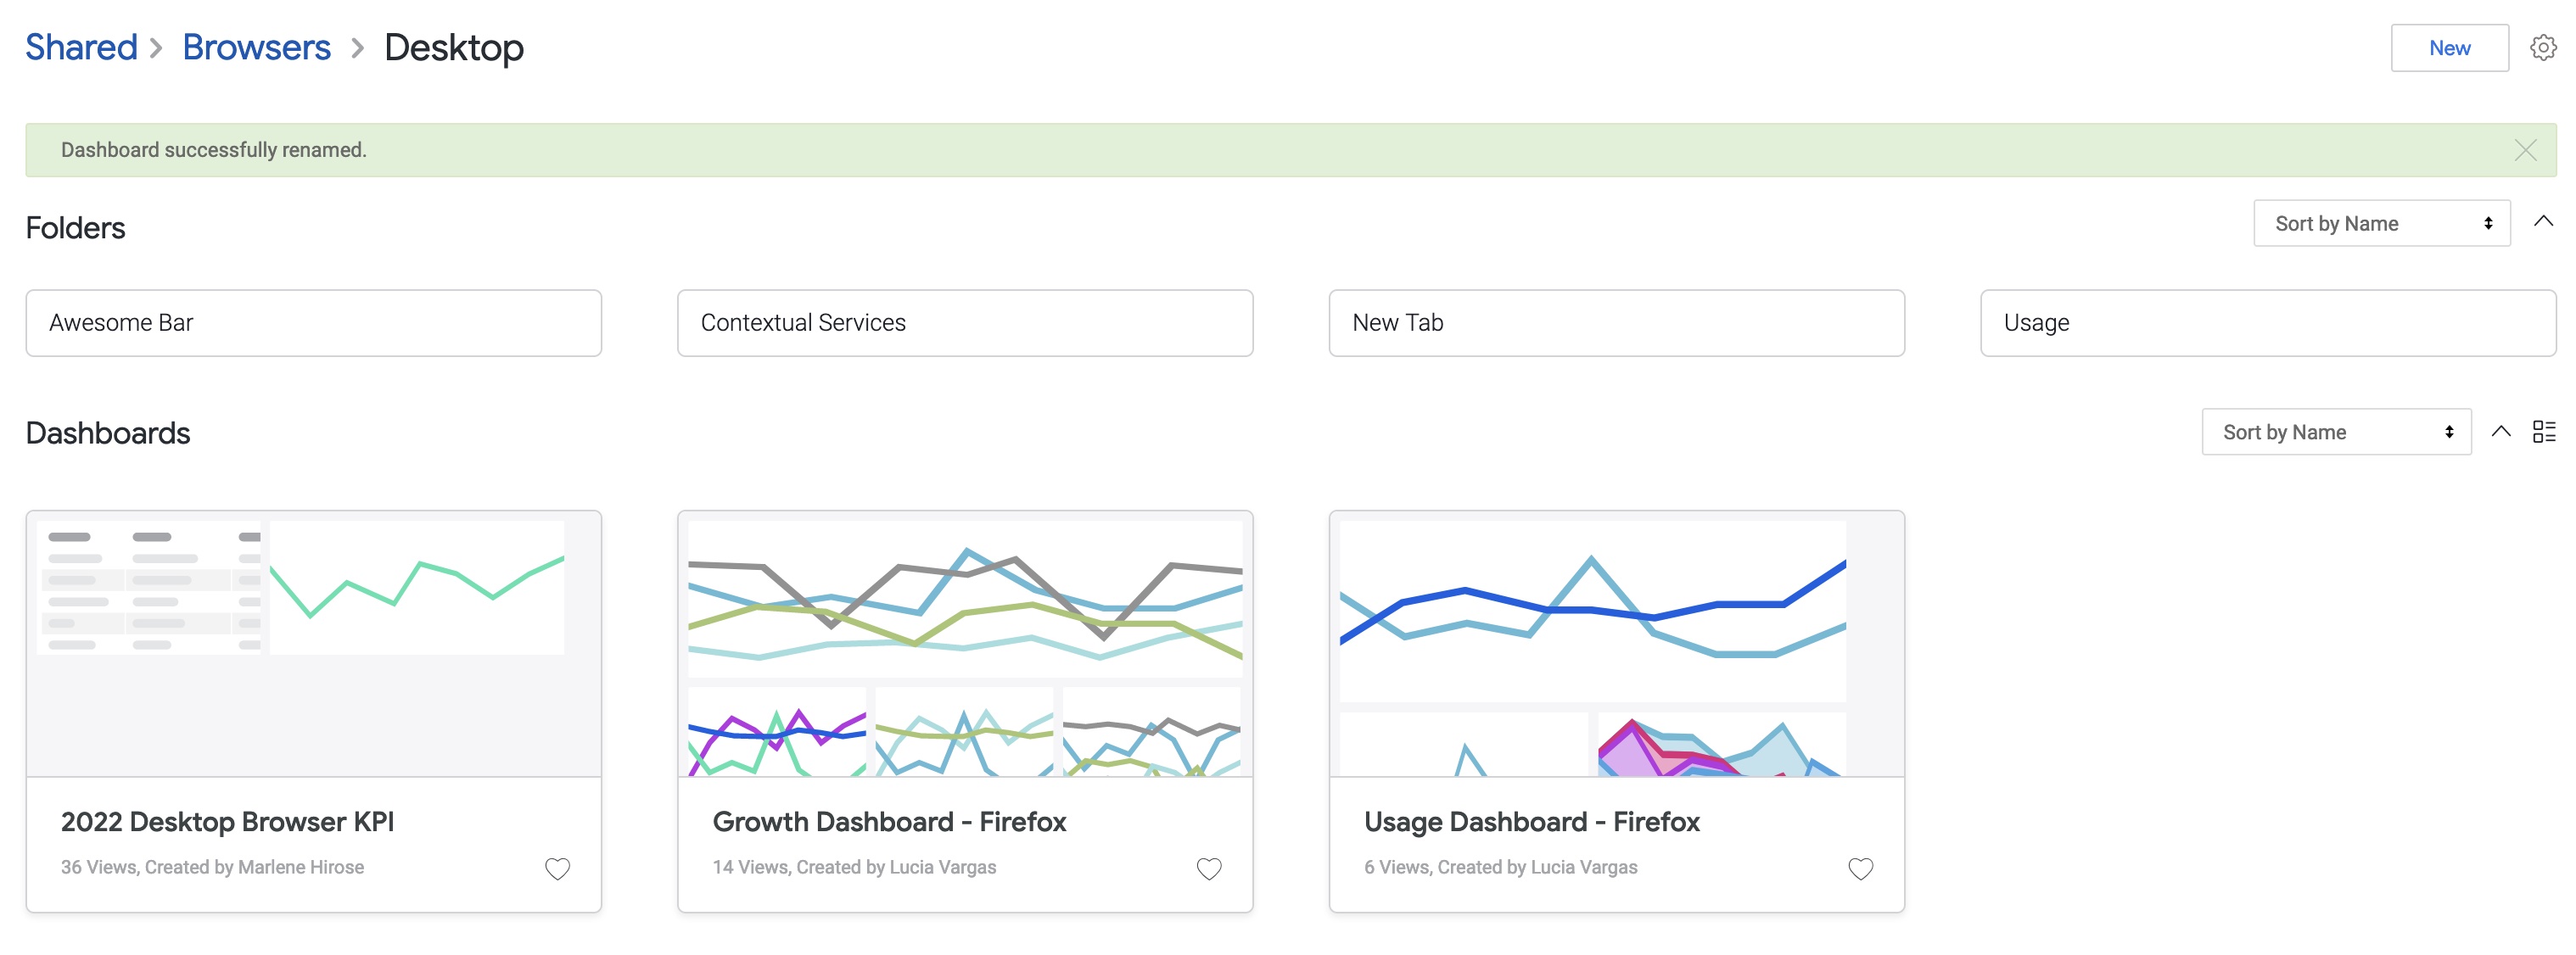
In Looker home screen go to Shared > Browsers and find the Desktop and Mobile consolidated dashboards inside the corresponding folder.
⚠️ Find Looker in the SSO Dashboard.
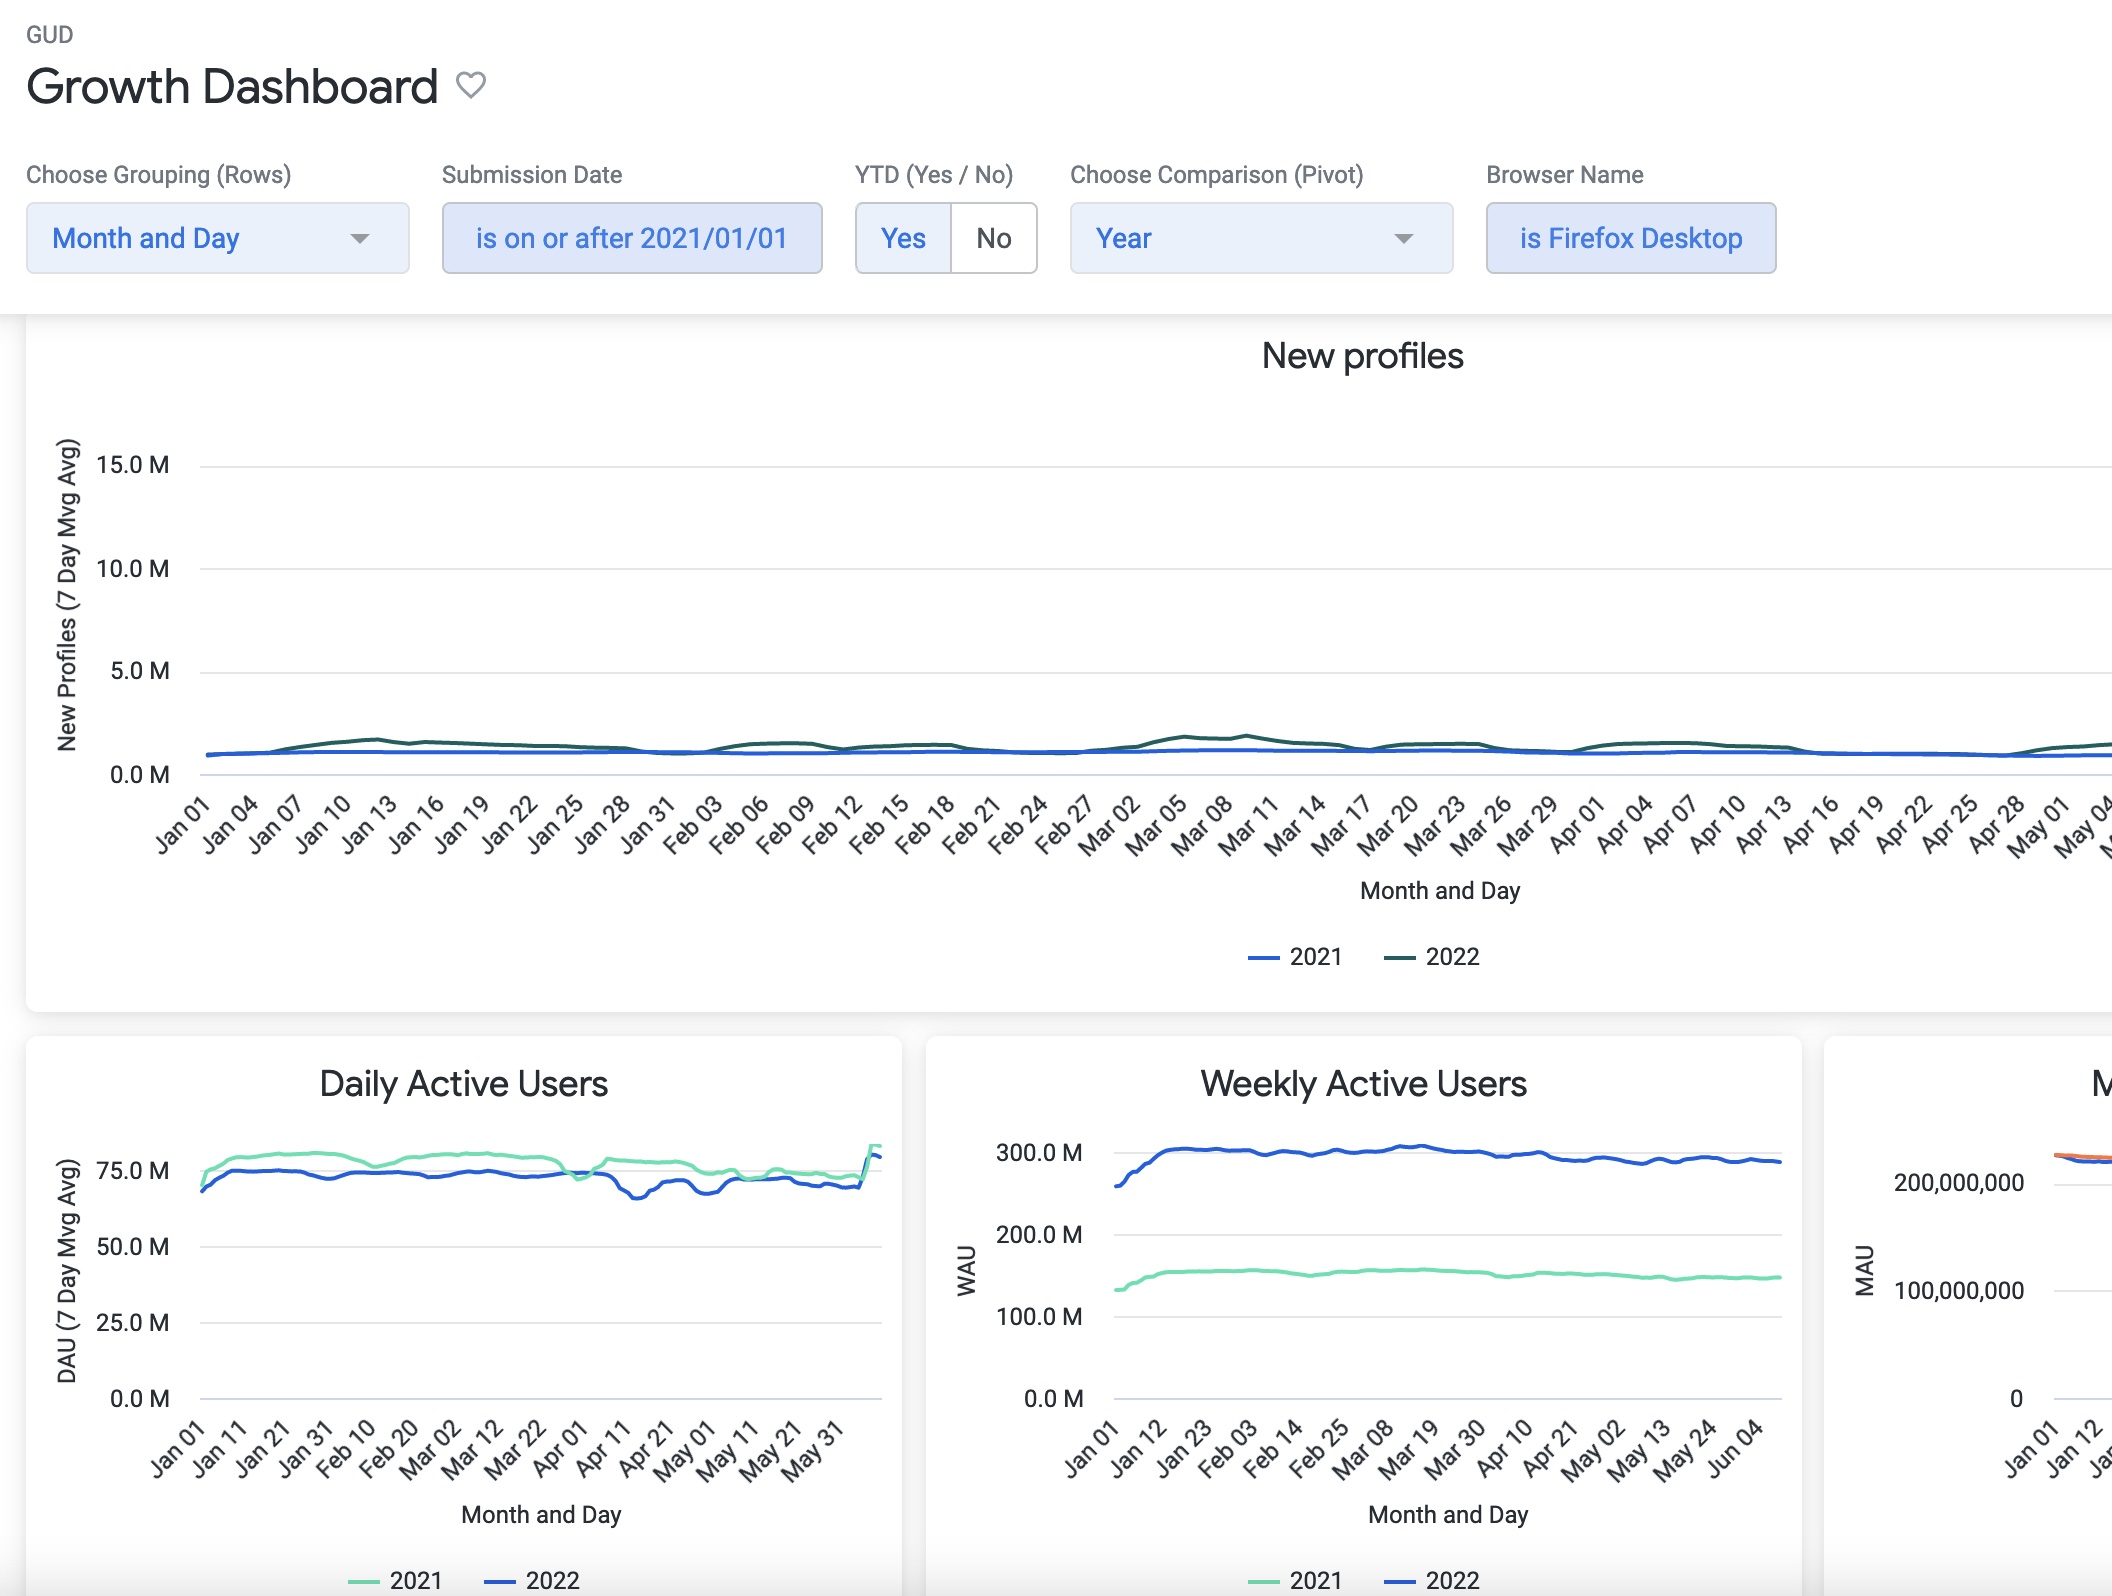
Growth Dashboard
Find in this dashboard:
- The visualizations of daily, weekly and monthly active users in comparison with the previous year.
- The visualization of new profiles in comparison with the previous period.
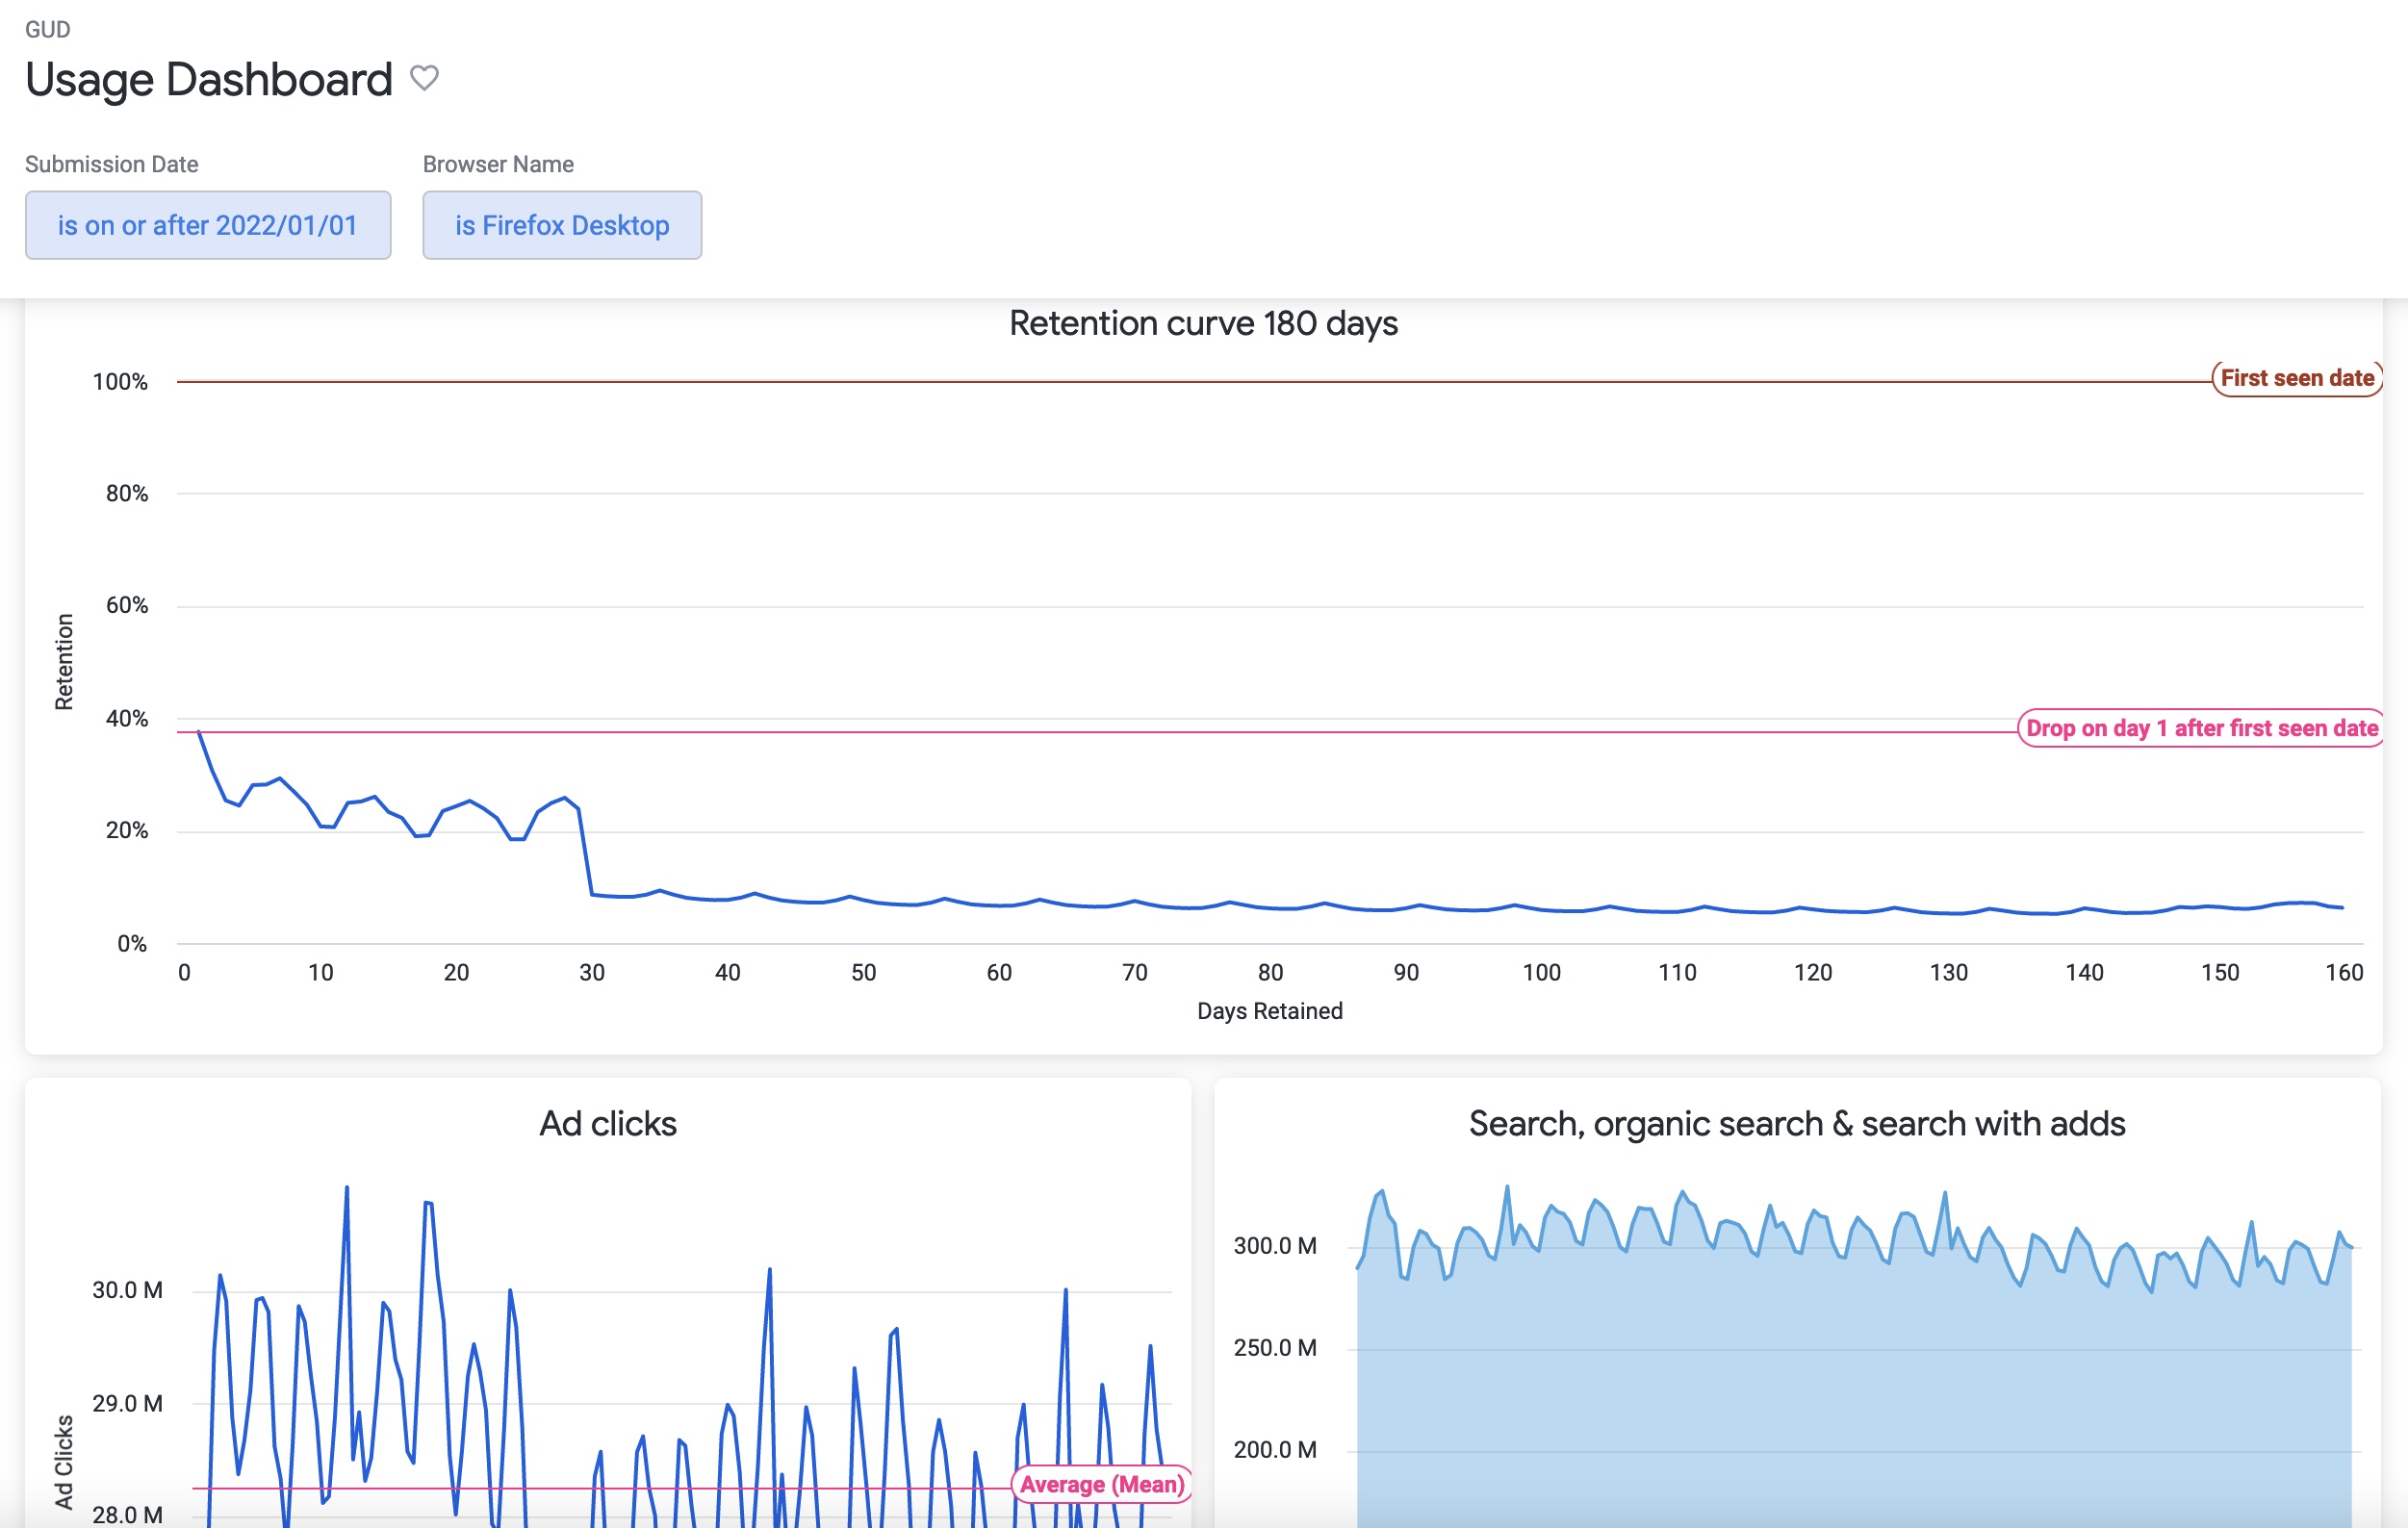
Usage Dashboard
Find in this dashboard:
- The retention curve for cohorts over a period of 180 days from the first seen date.
- The visualization of search, organic search and search with adds.
- The visualization of Ad clicks behaviour.
Browser Looks
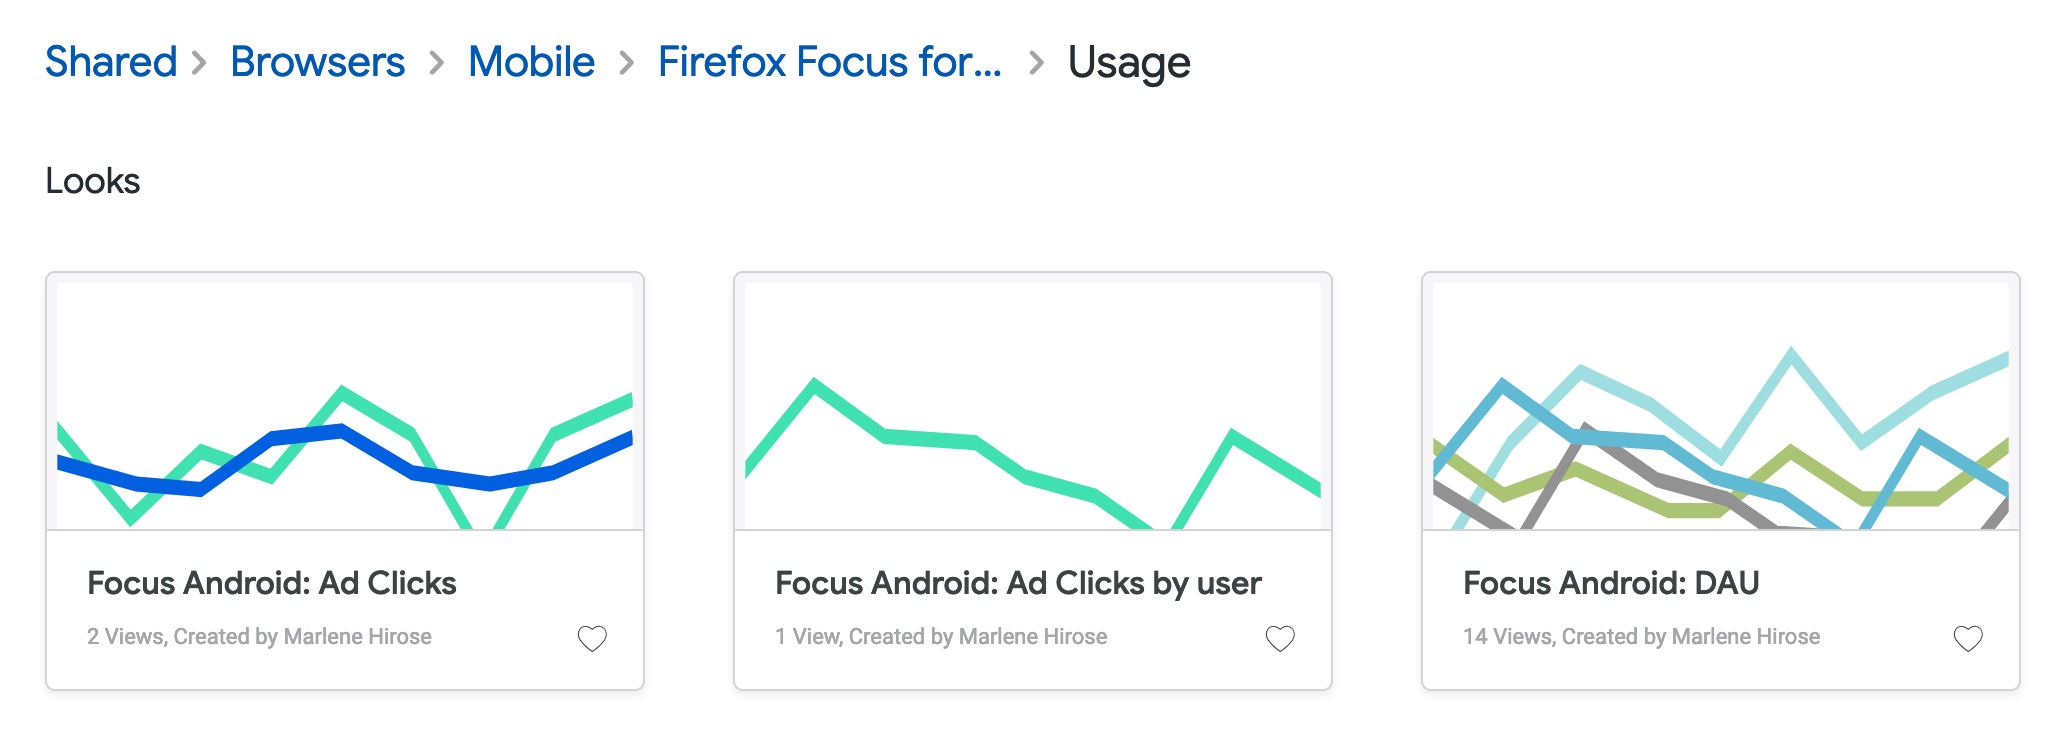
If you want to explore each individual visualization in Looker for the browsers, find them in the Usage folder inside the relevant browser name folder:
Shared > Browsers > Desktop > Usage
Shared > Browsers > Mobile > Firefox Focus for Android > Usage
Shared > Browsers > Mobile > Firefox Focus for iOS > Usage
Shared > Browsers > Mobile > Firefox for Android > Usage
Shared > Browsers > Mobile > Firefox for iOS > Usage
The example below shows the location of the Looks for Firefox Focus for Android:
Source
The dashboards and views for growth and usage are based on the moz-fx-data-shared-prod.telemetry.active_users_aggregates table, which contains the dimensions and metrics for desktop and mobile, as calculated from the clients_last_seen and mobile_search_clients_daily_v1 tables.
Note. The dashboards have been migrated to Looker from the previous GUD Dashboard at https://mozilla.github.io/gud/ as part of the Looker on-boarding and with the purpose of enhancement with new dimensions of analysis and improved performance.