An overview of Mozilla’s Data Pipeline
Note: This article describes the AWS-based pipeline which has been retired; the client-side concepts here still apply, but this article has been updated to reflect the new GCP pipeline.
This post describes the architecture of Mozilla’s data pipeline, which is used to collect Telemetry data from our users and logs from various services. One of the cool perks of working at Mozilla is that most of what we do is out in the open and because of that I can do more than just show you some diagram with arrows of our architecture; I can point you to the code, script & configuration that underlies it!
To make the examples concrete, the following description is centered around the collection of Firefox Telemetry data. The same tool-chain is used to collect, store and analyze data coming from disparate sources though, such as service logs.
graph TD
  firefox((fa:fa-firefox Firefox))-->|JSON| elb
  elb[Load Balancer]-->|JSON| nginx
  nginx-->|JSON| landfill(fa:fa-database S3 Landfill)
  nginx-->|protobuf| kafka[fa:fa-files-o Kafka]
  kafka-->|protobuf| cep(Hindsight CEP)
  kafka-->|protobuf| dwl(Hindsight DWL)
  cep--> hsui(Hindsight UI)
  dwl-->|protobuf| datalake(fa:fa-database S3 Data Lake)
  dwl-->|parquet| datalake
  datalake-->|parquet| prestodb
  prestodb-->redash[fa:fa-line-chart Redash]
  datalake-->spark
  spark-->datalake
  airflow[fa:fa-clock-o Airflow]-->|Scheduled tasks|spark{fa:fa-star Spark}
  spark-->|aggregations|rdbms(fa:fa-database PostgreSQL)
  rdbms-->tmo[fa:fa-bar-chart TMO]
  rdbms-->cerberus[fa:fa-search-plus Cerberus]


style firefox fill:#f61
style elb fill:#777
style nginx fill:green
style landfill fill:tomato
style datalake fill:tomato
style kafka fill:#aaa
style cep fill:palegoldenrod
style dwl fill:palegoldenrod
style hsui fill:palegoldenrod
style prestodb fill:cornflowerblue
style redash fill:salmon
style spark fill:darkorange
style airflow fill:lawngreen
style rdbms fill:cornflowerblue
style tmo fill:lightgrey
style cerberus fill:royalblue
Firefox
There are different APIs and formats to collect data in Firefox, all suiting different use cases:
- histograms – for recording multiple data points;
- scalars – for recording single values;
- timings – for measuring how long operations take;
- events – for recording time-stamped events.
These are commonly referred to as probes. Each probe must declare the collection policy it conforms to: either release or prerelease. When adding a new measurement data-reviewers carefully inspect the probe and eventually approve the requested collection policy:
- Release data is collected from all Firefox users.
- Prerelease data is collected from users on Firefox Nightly and Beta channels.
Users may choose to turn the data collection off in preferences.
A session begins when Firefox starts up and ends when it shuts down. As a session could be long-running and last weeks, it gets sliced into smaller logical units called subsessions. Each subsession generates a batch of data containing the current state of all probes collected so far, i.e. a main ping, which is sent to our servers. The main ping is just one of the many ping types we support. Developers can create their own ping types if needed.
Pings are submitted via an API that performs a HTTP POST request to our edge servers. If a ping fails to successfully submit (e.g. because of missing internet connection), Firefox will store the ping on disk and retry to send it until the maximum ping age is exceeded.
Kafka
HTTP submissions coming in from the wild hit a load balancer and then an NGINX module. The module accepts data via a HTTP request which it wraps in a Hindsight protobuf message and forwards to two places: a Kafka cluster and a short-lived S3 bucket (landfill) which acts as a fail-safe in case there is a processing error and/or data loss within the rest of the pipeline. The deployment scripts and configuration files of NGINX and Kafka live in a private repository.
The data from Kafka is read from the Complex Event Processors (CEP) and the Data Warehouse Loader (DWL), both of which use Hindsight.
Hindsight
Hindsight, an open source stream processing software system developed by Mozilla as Heka’s successor, is useful for a wide variety of different tasks, such as:
- converting data from one format to another;
- shipping data from one location to another;
- performing real time analysis, graphing, and anomaly detection.
Hindsight’s core is a lightweight data processing kernel written in C that controls a set of Lua plugins executed inside a sandbox.
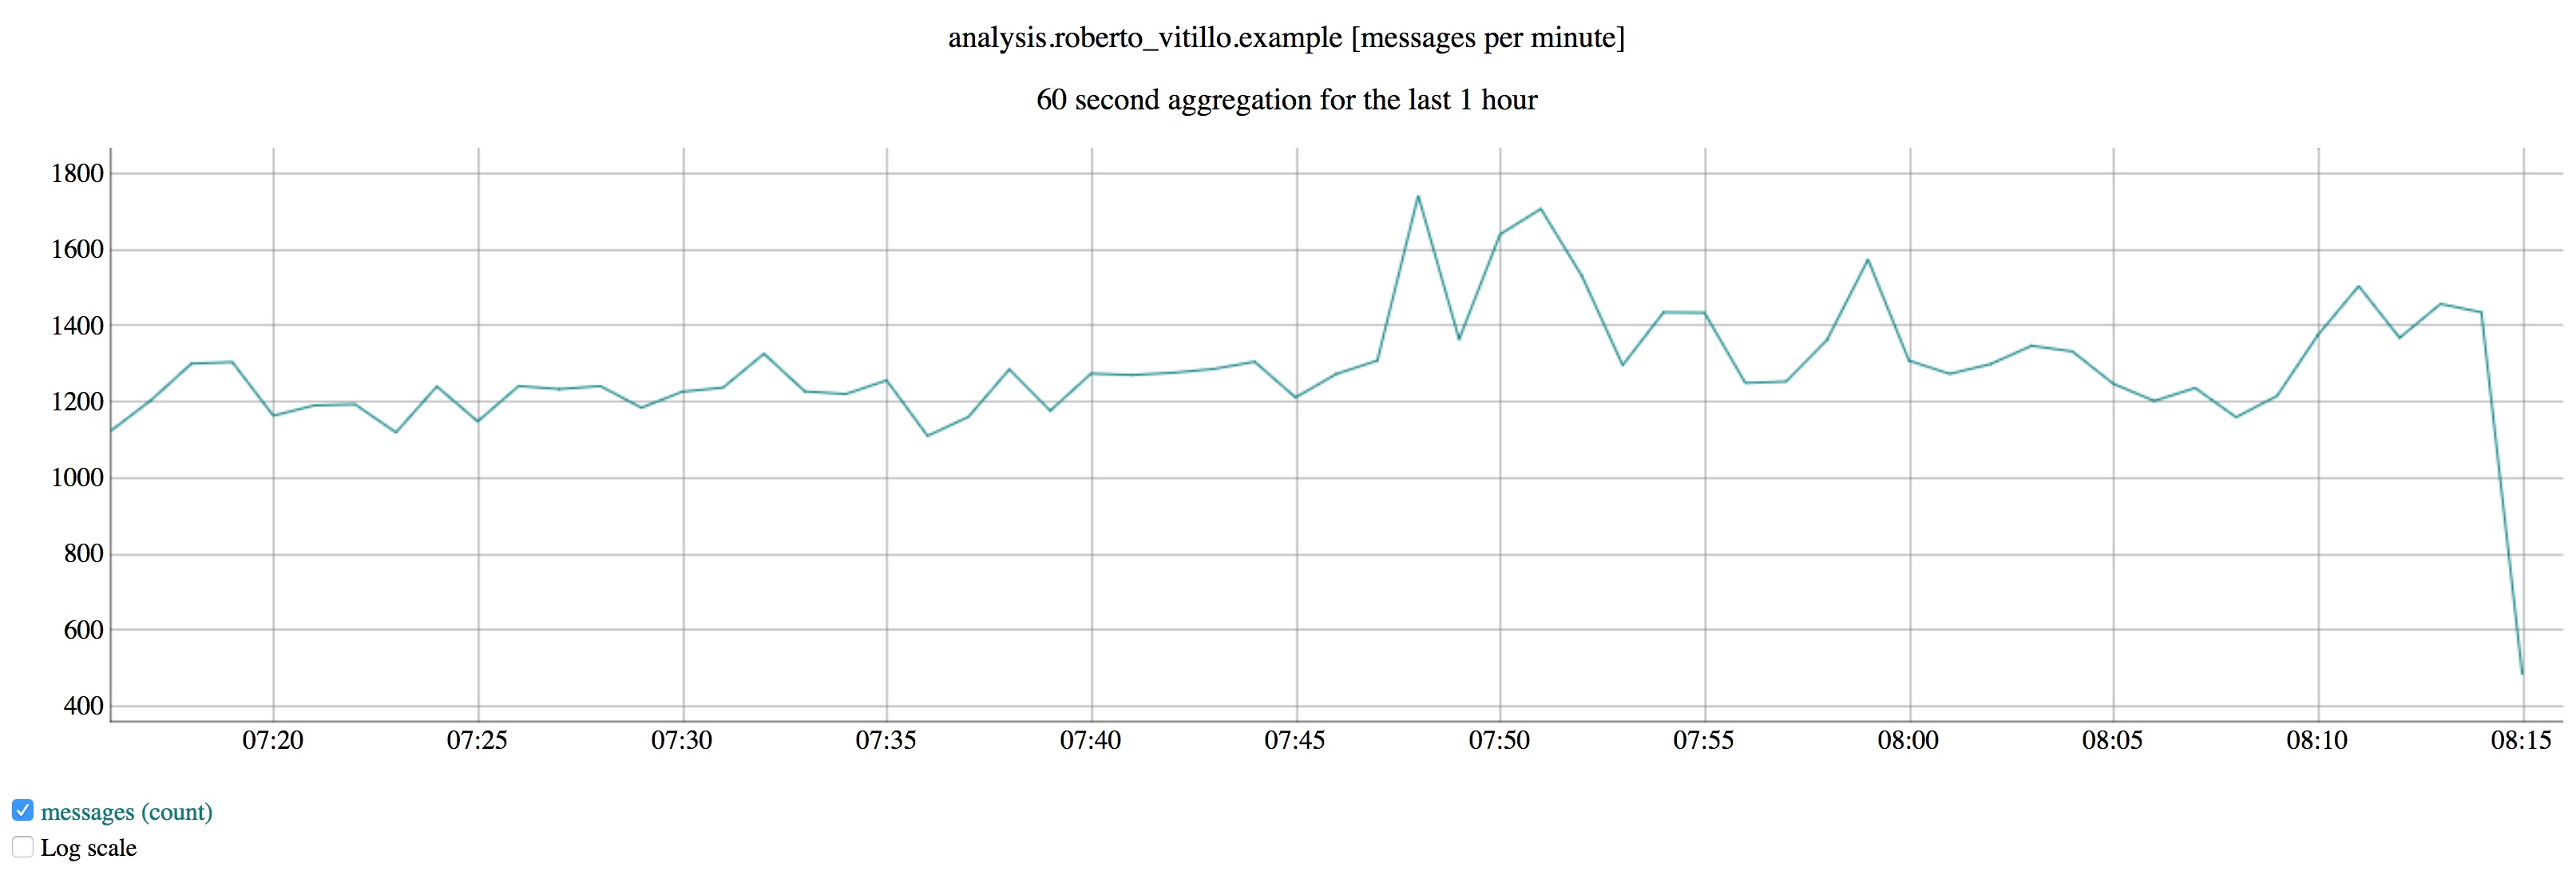
The CEP are custom plugins that are created, configured and deployed from an UI which produce real-time plots like the number of pings matching a certain criteria. Mozilla employees can access the UI and create/deploy their own custom plugin in real-time without interfering with other plugins running.

The DWL is composed of a set of plugins that transform, convert & finally shovel pings into S3 for long term storage. In the specific case of Telemetry data, an input plugin reads pings from Kafka, pre-processes them and sends batches to S3, our data lake, for long term storage. The data is compressed and partitioned by a set of dimensions, like date and application.
The data has traditionally been serialized to Protobuf sequence files which contain some nasty “free-form” JSON fields. Hindsight gained recently the ability to dump data directly in Parquet form though.
The deployment scripts and configuration files of the CEP & DWL live in a private repository.
Spark
Once the data reaches our data lake on S3 it can be processed with Spark on Mozilla's Databricks instance. Databricks allows Mozilla employees to write custom analyses in notebooks, and also schedule Databricks jobs to run periodically.
As mentioned earlier, most of our data lake contains data serialized to Protobuf with free-form JSON fields. Needless to say, parsing JSON is terribly slow when ingesting Terabytes of data per day. A set of ETL jobs, written in Scala by Data Engineers and scheduled with Airflow, create Parquet views of our raw data. We have a Github repository telemetry-batch-view that showcases this.
Aggregates Dataset
graph TD
%% Data Flow Diagram for mozaggregator/TMO-adjacent services
firefox((fa:fa-firefox Firefox)) --> |main ping| pipeline
fennec((fa:fa-firefox Fennec)) --> |saved-session ping| pipeline
pipeline((Telemetry Pipeline))

subgraph mozaggregator
  service(service)
  aggregator
  rdbms(fa:fa-database PostgreSQL)
end

pipeline --> aggregator
pipeline --> spark{fa:fa-star Spark}
pipeline --> redash[fa:fa-line-chart Redash]

subgraph telemetry.mozilla.org
  telemetry.js(telemetry.js) --> dist
  telemetry.js --> evo
  orphan[Update Orphaning]
  crashdash[tmo/crashes]
end

redash --> crashdash
service --> telemetry.js
spark --> orphan

telemetry.js --> telemetry-next-node(telemetry-next-node)
subgraph alerts.tmo
  cerberus[fa:fa-search-plus Cerberus] -->medusa
  medusa --> html
  medusa --> email
end

telemetry-next-node --> cerberus

style redash fill:salmon
style spark fill:darkorange
style rdbms fill:cornflowerblue
style cerberus fill:royalblue
style firefox fill:#f61
style fennec fill:#f61
style telemetry.js fill:lightgrey
style dist fill:lightgrey
style evo fill:lightgrey
A dedicated Spark job feeds daily aggregates to a PostgreSQL database which powers a HTTP service to easily retrieve faceted roll-ups. The service is mainly used by TMO, a dashboard that visualizes distributions and time-series, and Cerberus, an anomaly detection tool that detects and alerts developers of changes in the distributions. Originally the sole purpose of the Telemetry pipeline was to feed data into this dashboard but in time its scope and flexibility grew to support more general use-cases.

Presto & STMO
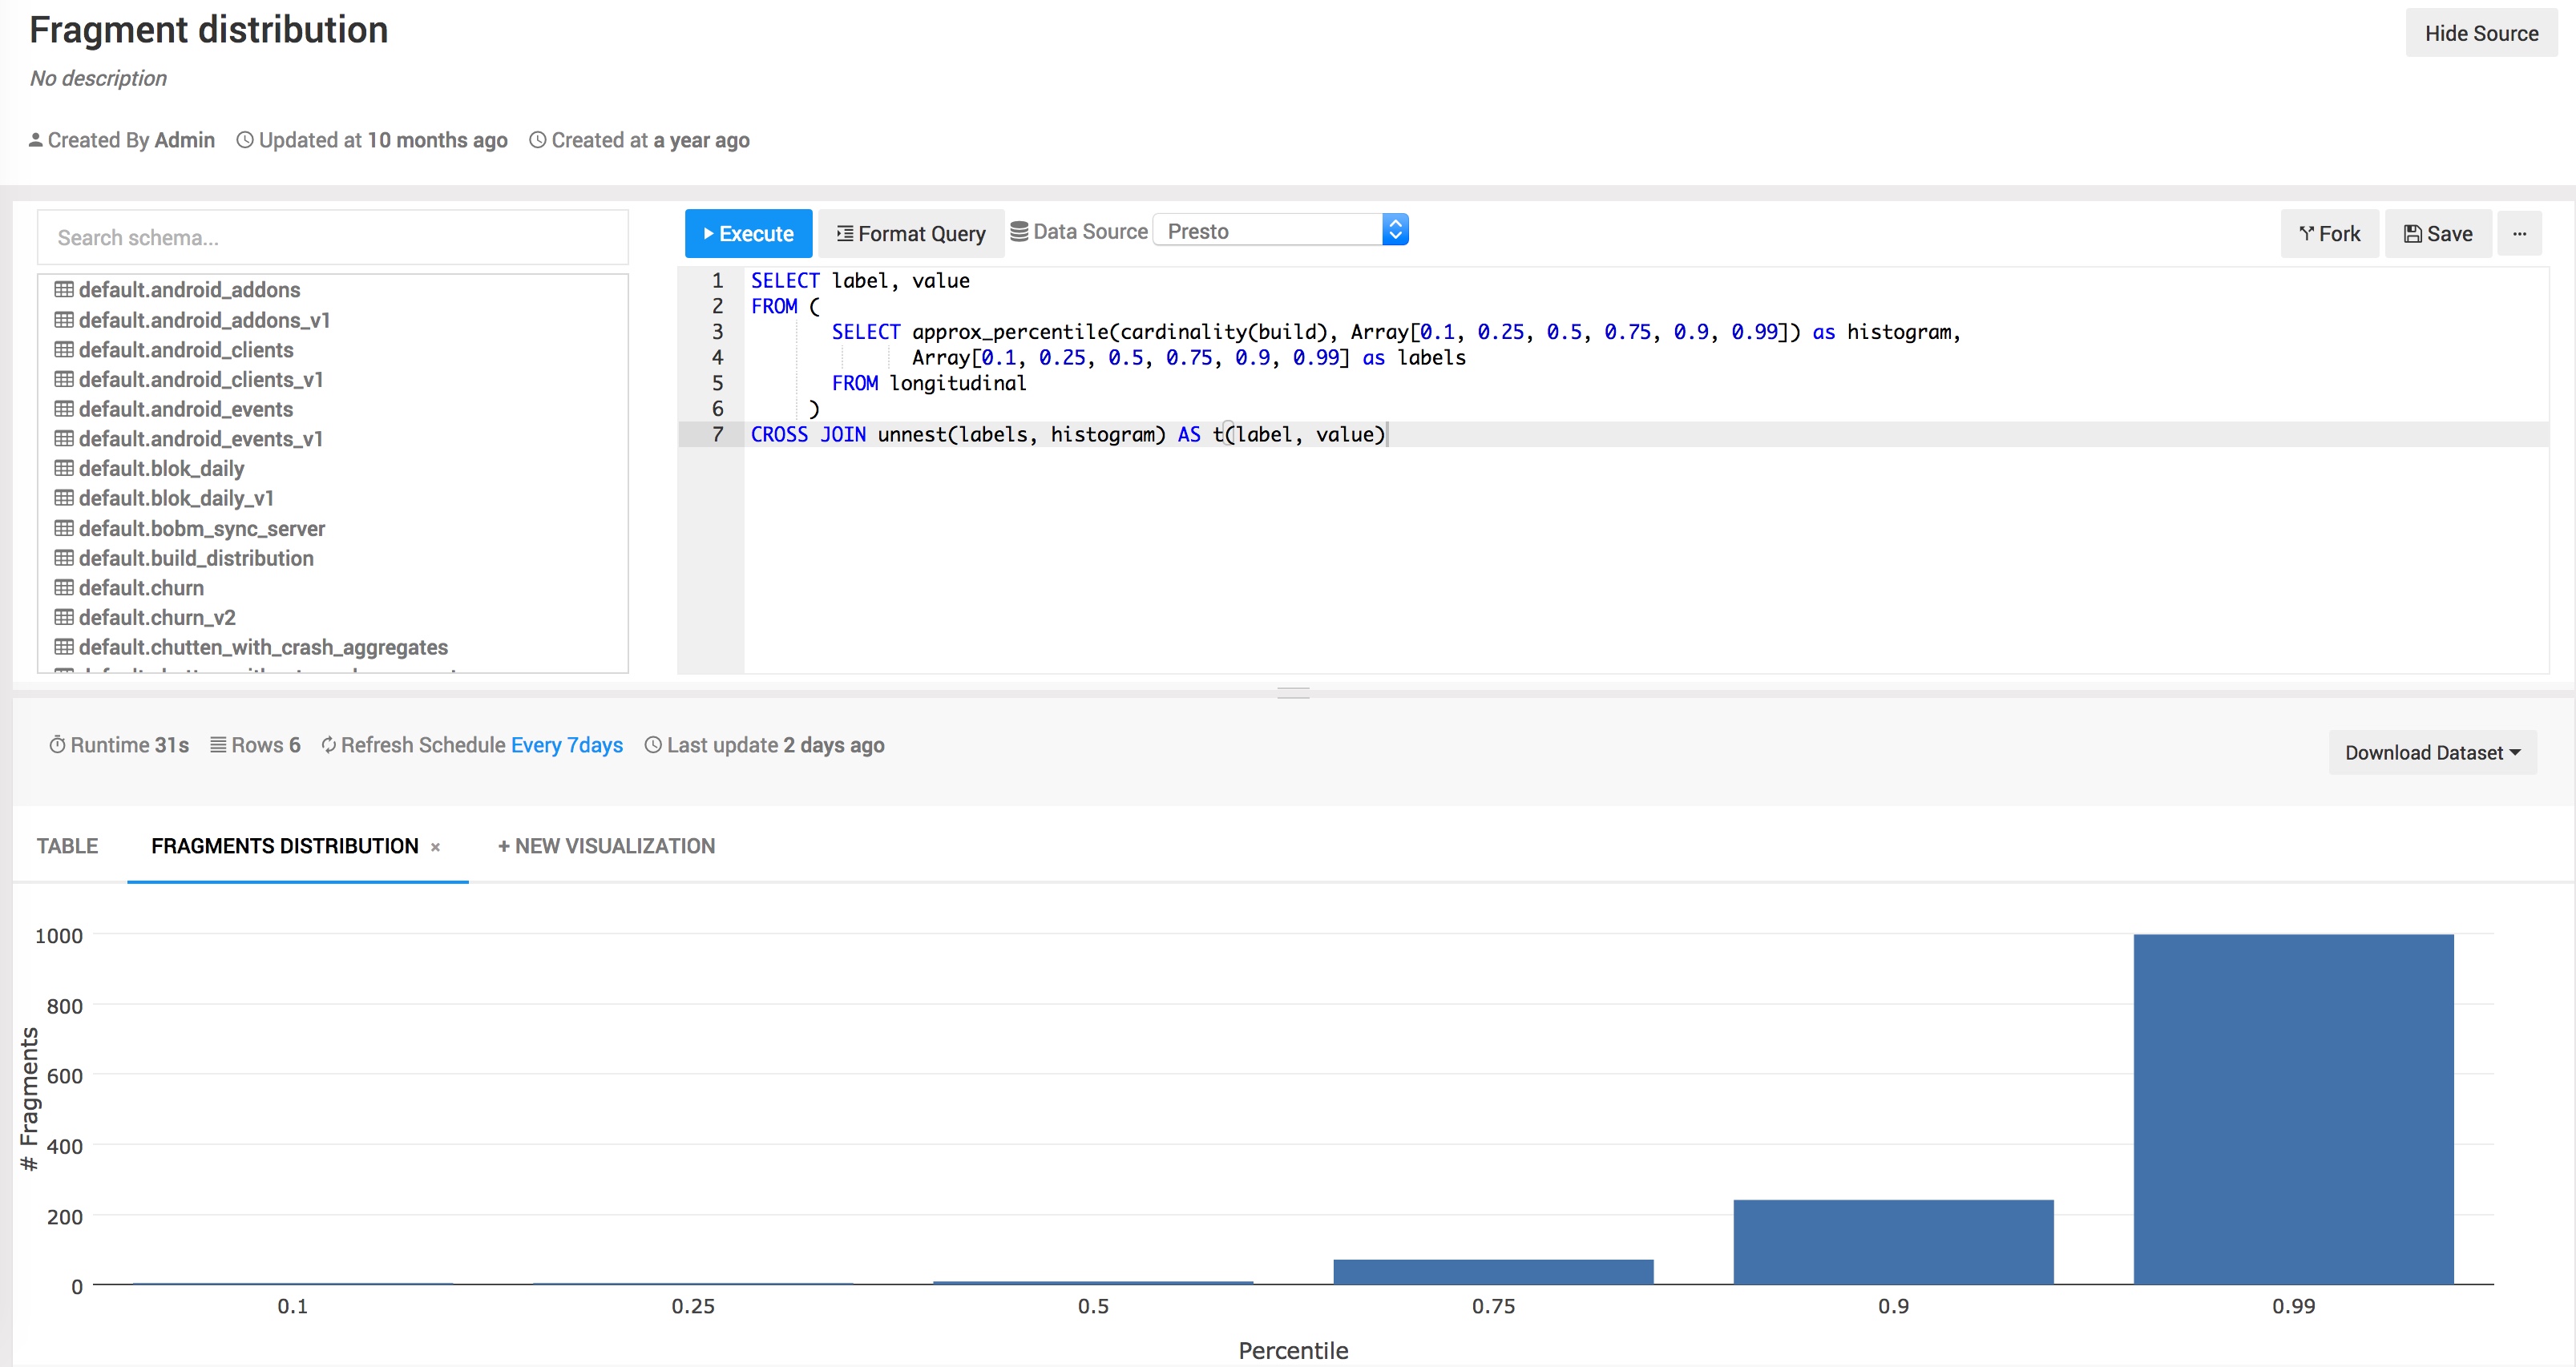
We maintain a couple of Presto clusters and a centralized Hive metastore to query Parquet data with SQL. The Hive metastore provides an universal view of our Parquet dataset to both Spark and Presto clusters.
Presto, and other databases, are behind a Redash service (STMO) which provides a convenient & powerful interface to query SQL engines and build dashboards that can be shared within the company. Mozilla maintains its own fork of Redash to iterate quickly on new features, but as good open source citizen we push our changes upstream.

Is that it?
No, not really. If you want to read more, check out this article. For example, the DWL pushes some of the Telemetry data to Redshift and other tools that satisfy more niche needs. The pipeline ingests logs from services as well and there are many specialized dashboards out there I haven’t mentioned.
There is a vast ecosystem of tools for processing data at scale, each with their pros & cons. The pipeline grew organically and we added new tools as new use-cases came up that we couldn’t solve with our existing stack. There are still scars left from that growth though which require some effort to get rid of, like ingesting data from schema-less format.