Glean
For Mozilla, getting reliable data from our products is critical to inform our decision making. Glean is our new product analytics & telemetry solution that provides a consistent experience and behavior across all of our products.
The list of supported platforms and implementations is available in the Glean SDK Book.
Note that this is different from Telemetry for Firefox Desktop although it provides similar capabilities.
Contents:
Overview
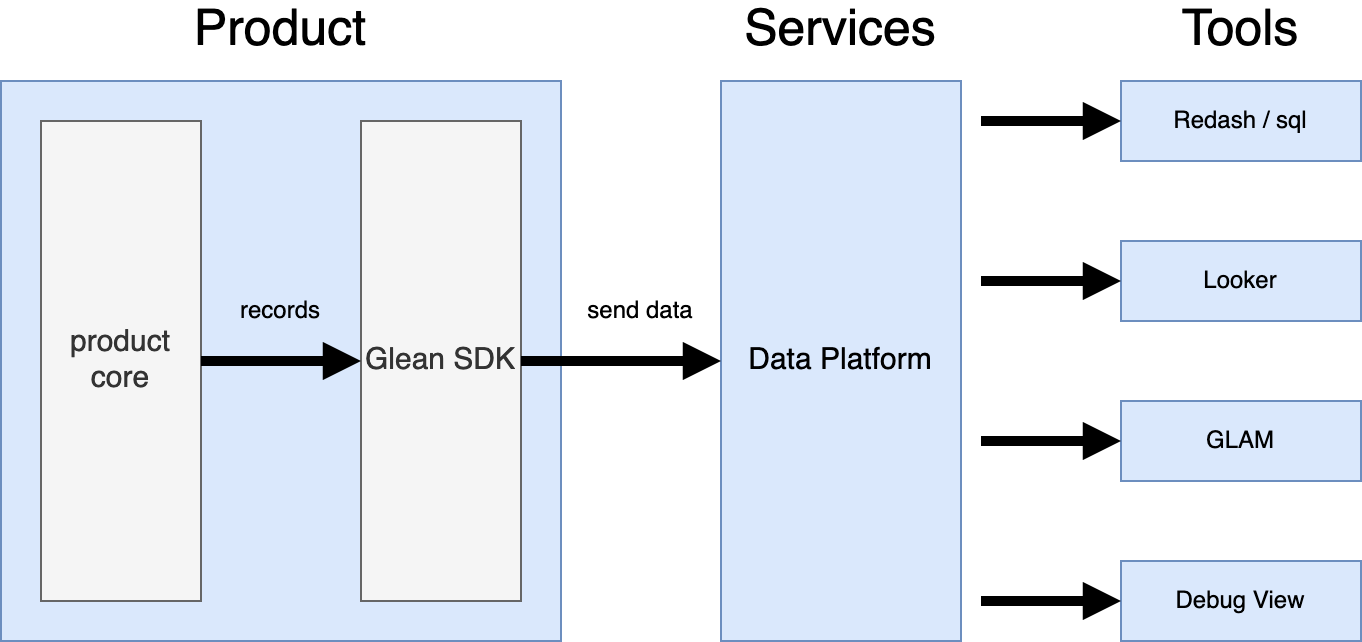
The Glean SDK performs measurements and sends data from our products. It provides a set of metric types for individual measurements that are carefully designed to avoid common pitfalls with measurement. Metrics are then rolled up into pings to send over the network. There are a number of built-in pings that are sent on predefined schedules, but it also possible to send custom pings at any desired cadence.
The Data Platform validates and stores these pings in database tables. A fault tolerant design allows data to be retained in the event of problems such as traffic spikes or invalid data. See An overview of Mozilla’s Data Pipeline for details. Derived and cleaned data can also be automatically created at this stage.
The Analysis Tools are used to query and visualize the data. This includes Redash, Looker, GLAM and the Debug Ping View. Because Glean knows more about the individual data, such as its type and the ranges of acceptable values, it can in many cases provide the most appropriate visualization automatically.
The Glean design principles
Provide a consistent base of telemetry
A baseline of analysis is important for all our products, from counting active users to retention and session times. This is supported out-of-the-box by the SDK, and funnels directly into visualization tools like the Growth and Usage Dashboard (GUD).
Metrics that are common to all products, such as the operating system and architecture, are provided automatically in a consistent way.
Any issues found with these base metrics only need to be fixed in Glean to benefit all SDK-using products.
Encourage specificity
Rather than just treating metrics as generic data points, Glean wants to know as much as possible about the things being measured, and be opinionated about how data is measured and aggregated.
From this information, it can:
- Provide a well-designed API to perform specific types of measurements, which is consistent and avoids common pitfalls
- Reject invalid data, and report them as errors
- Store the data in a consistent way, rather than custom, ad hoc data structures
- Provide the most appropriate visualization and analysis automatically
A side-effect of this design is that Glean telemetry is write-only: it would be impossible to enforce all of these constraints and achieve all of these benefits if client code could read, modify and update data.
Follow lean data practices
The Glean system enforces that all measurements received data review, and it is impossible to collect measurements that haven't been declared. It also makes it easy to limit data collection to only what's necessary:
- Enforced expiration dates for every metric
- Some metric types can automatically limit resolution
- It's easy to send data that isn't associated with the client id
Glean also supports data transparency by automatically generating documentation for all of the metrics sent by an application.
Provide a self-serve experience
Adding new metric is designed to be as easy as possible. Simply by adding a few lines of configuration, everything to make them work across the entire suite of tools happens automatically. This includes previously manual and error-prone steps such as updating the ping payload and database schemas.
How to use Glean
-
Integrate the Glean SDK into your product.
-
Use Looker to build Explores and Dashboards using your product's datasets.
-
If Looker does not provide the necessary Explores you can resort to using Redash to write SQL queries & build dashboards using your products datasets, e.g.:
org_mozilla_fenix.baselineorg_mozilla_fenix.eventsorg_mozilla_fenix.metrics- There is more documentation about accessing Glean data.
-
For experimentation, you can use Nimbus SDK, which integrates with Glean.
Contact
#gleanon slack- #glean:mozilla.org on matrix
glean-team@mozilla.comto reach out
References
- The Glean SDK implementation.
- Reporting issues & bugs for the Glean SDK.
- Datasets documentation (TBD)