Active Users Aggregates reference
- Introduction
- Background
- Datasets
- Scheduling
- Code Reference
- Change control
- Location and how to query
- Looker visualizations with period over period analysis
Introduction
The active_users_aggregates is a set of tables designed for analysis of client
activity on a daily, weekly and monthly basis, starting from the submission date
of the first baseline ping received by our servers.
Background
Phase 1
These aggregates were initially designed to support the migration of the GUD Growth and Usage Dashboard as designed in the Initial proposal. This resulted in three views that collect data for all browsers:
telemetry.active_users_aggregatesfor an overall analysis of active users and search metrics.telemetry.active_users_aggregates_devicefor analysis of active users based on unique devices where the client is installed.telemetry.active_users_aggregates_attributionfor analysis of active users based on the first attribution reported by each client.
Phase 2
As part of the performance and quality improvement efforts and to support the kpi source of truth proposal,
the view telemetry.active_users_aggregates is now based in two views, for Desktop and Mobile data.
The underlying setup is one table per browser, located in the corresponding BigQuery dataset, e.g. fenix_derived.active_users_aggregates_v1.
This new setup has a set of benefits:
- Data can be queried per browser, which reduces the amount of data scanned for lower query cost and improves query response time.
- Browser specific logic and KPIs only require modifying the corresponding table and immediately reflects in the unioned views without further effort.
- Browser specific implementations only require the backfill of the corresponding table, which results in reduced cost and time.
Datasets
Active users aggregates
This aggregates contains the metrics daily, weekly and monthly active users, new profile and search counts aggregated by product and various business dimensions: attribution, channel, country, city, date, device model, distribution id, segment, OS details.
Active users aggregates for device
The active_users_aggregates_device contains the metrics of
daily, weekly and monthly active users, new profiles and search counts
with additional detail of the OS and device where the client is installed.
The reason to have this aggregate in addition to active_users_aggregates
is to improve the query performance for final users, by separating the
device analysis, which makes one of the biggest size columns in the table,
as most devices have unique identifiers.
Active users aggregates for attribution
The active_users_aggregates_attribution contains the metrics of
daily, weekly and monthly active users, new profiles and search counts
to retrieve the source and context of each client installation and the cohorts
behaviour.
It can be used to query the set attribution parameters in the context
of the business core dimensions: country, submission_date, app_name
and if the browser is set to default.
The reason to have this aggregate in addition to active_users_aggregates
is to improve the query performance for final users, by separating the
analysis of the numerous attribution parameters, which is required with
less regularity than other dimensions and mostly for specific purposes.
E.g. During investigations or for marketing campaigns.
This aggregate retrieves Fenix attribution information from
fenix.firefox_android_clients.
Scheduling
These datasets are scheduled to update daily at 3:30 hours in Airflow DAG
bqetl_analytics_aggregations
Code Reference
The query and metadata for unioned views (all browsers) is defined in the active_users_aggregates_
sub-folder in bigquery-etl under
telemetry_derived.
The query and metadata per browser are auto-generated using sql generators and can be accessed by selecting the generated-sql branch in the bigquery-etl GitHub repository and navigating to the browser's sub-folder. E.g. Firefox desktop query.
Change control
The underlying tables for each browser aggregate are subject to change-control.
This follows the Infrastructure Change Control process and implies that any modifications to the corresponding code in GitHub will require the approval of members of the Data Science and Data Engineering teams.
Location and how to query
| BigQuery view | Notes / Location in Looker |
|---|---|
firefox_desktop.active_users_aggregates | Firefox Desktop. Windows, Linux, MacOS (OS = 'Darwin'). |
firefox_ios.active_users_aggregates | Firefox iOS |
fenix.active_users_aggregates | Fenix |
focus_android.active_users_aggregates | Focus Android |
focus_ios.active_users_aggregates | Focus iOS |
klar_ios.active_users_aggregates | Klar iOS |
telemetry.active_users_aggregates_mobile | Unioned view of mobile browsers. |
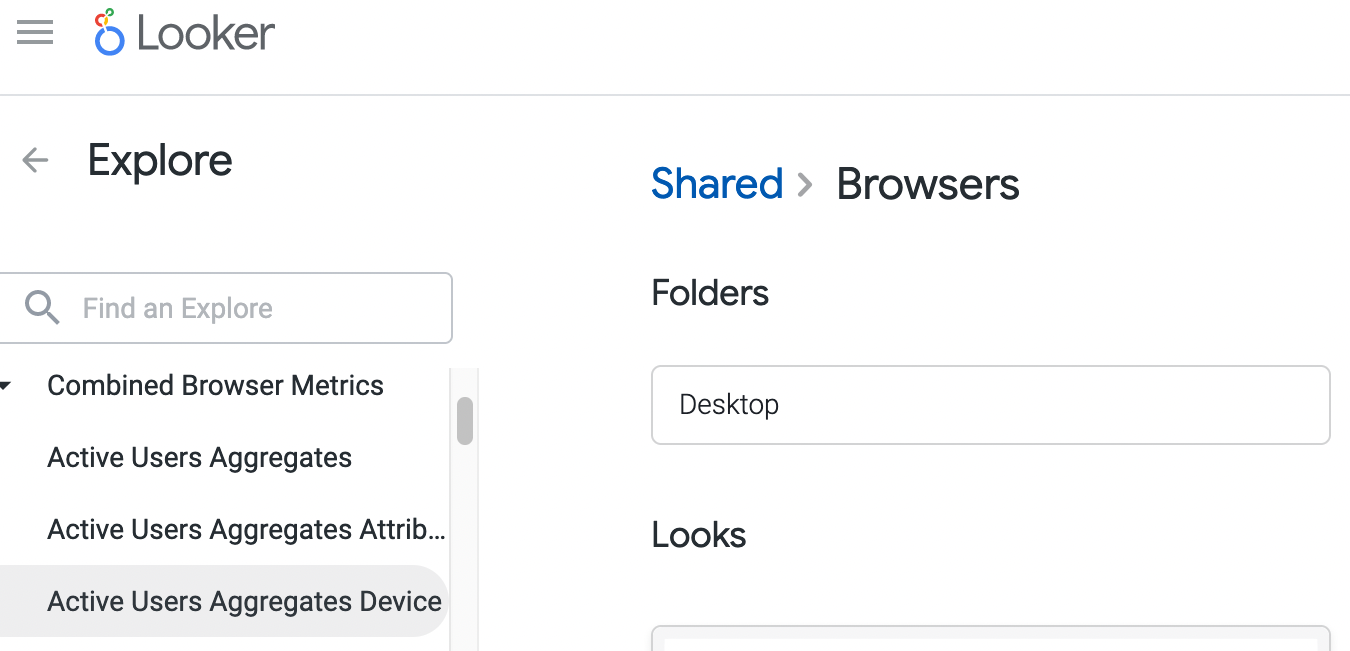
telemetry.active_users_aggregates | Unioned view of mobile & desktop browsers. Looker Explore |
telemetry.active_users_aggregates_device | Unioned view of mobile & desktop browsers. Looker Explore |
telemetry.active_users_aggregates_attribution | Unioned view of mobile & desktop browsers. Looker Explore |
Looker visualizations with period over period analysis
The Usage folder for Mobile and Desktop browsers
includes a set of visualizations that you can access directly and are enhanced
with the period over period analysis.